03 — Data Analysis

NFL Draft Prediction

Predicting Draft Outcomes for College Quarterbacks — COGS 108

RoleData Analyst (Group)
CourseCOGS 108 — Data Science in Practice
ToolsPython · Pandas · Matplotlib · Seaborn

Can numbers
predict a draft pick?

Can a college quarterback's combine numbers and college stats predict whether they'll get drafted into the NFL? This COGS 108 group project set out to find out.

Using NFL Combine and NCAA datasets, we explored whether measurables like 40-yard dash time, TD/INT ratio, and total yards could reliably separate drafted from undrafted QBs.

The answer was nuanced: trends exist, but no single metric is decisive. The draft reflects a complex mix of performance, athleticism, and context — a finding with real implications for how scouting data should be visualized for decision-makers.

2Datasets
5+Key Metrics
EDAMethodology
View on GitHub →
MyFinalProject_SP25 Public
📓ProjectProposal_Group072_SP25.ipynb
📓DataCheckpoint_Group072_SP25.ipynb
📓EDACheckpoint_Group072_SP25.ipynb
📓FinalProject_Group072_SP25.ipynb
Jupyter Notebook — 100%
40-yard dash time by draft verdict — actual project output
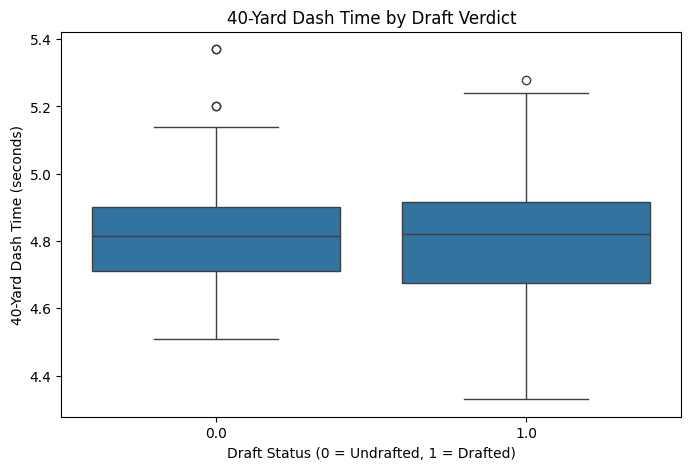
Boxplot: 40-yard dash time by draft verdict, from the actual analysis
TD/INT ratio by draft verdict — actual project output
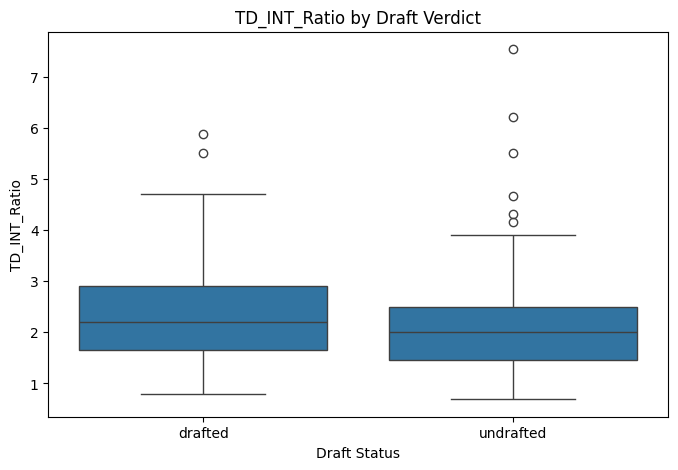
Boxplot: TD to interception ratio by draft verdict, from the actual analysis

EDA first,
conclusions second.

The project followed a full EDA pipeline: data collection and cleaning across two sources, exploratory visualization to identify distribution patterns, correlation analysis across key metrics, and a formal hypothesis test to evaluate whether the observed differences were statistically meaningful.

Metrics analyzed: 40-yard dash time, vertical jump, TD/INT ratio, completion percentage, total passing yards. No single metric cleanly separated the drafted from undrafted populations.

Trends exist.
Certainty doesn't.

Drafted QBs tend to post better combine numbers and college stats on average, but the overlap between the two groups is substantial. A QB can have below-average measurables and get drafted; a QB can have elite numbers and go undrafted.

The design implication: any dashboard or tool built for NFL scouts would need to show distributions and confidence ranges, not single-metric rankings. A single bar chart of "top 40 times" misrepresents what the data actually says.

← Back to All Projects